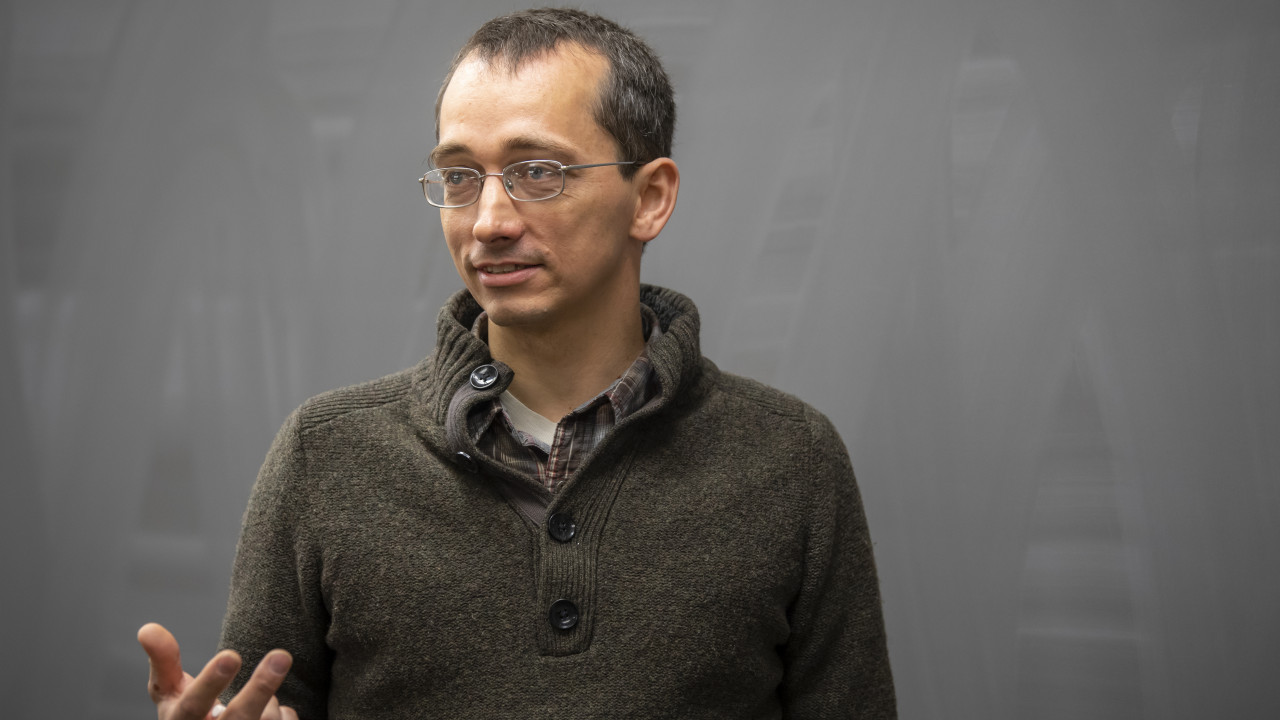
It never fails: every semester the moment arrives when Jacob Hale’s physics students need the boost.
Maybe everyone did poorly on a quiz. Or no one could grasp a particular concept. Frustration runs high. Doubts abound. Maybe they can’t be scientists after all.
Wrong, Hale says. And then he demonstrates why.
He calls it his graph of happiness.
He came up with the idea when he was nearing graduation with a Ph.D. from Purdue University, a period when he had plenty of ups and downs.
“I got to thinking, research is an interesting thing because you have so many downs in it,” he says. “I mean, there are so many problems with research. You’re failing all the time. Your equipment doesn’t work; your data don’t make sense; you get nasty reviews from reviewers of your paper. ...
“But when things do work, you have just these huge highs – I mean, just these huge peaks of excitement. You’re excited and you love it and it makes you forget all of the previous. You get just this burst of excitement that makes it all worth it.”
Later, while counseling a colleague, Hale translated his thoughts into an illustration – a graph, with time on the horizontal axis and happiness on the vertical, which had both positive and negative values.
Visualizing the graph enables a student to see that “failure is a part of learning and it’s not a negative thing, although it has negative feelings attached to it,” Hale says. “When we fail, we don’t like it; we’re not happy. But with this perspective of the role of failure in progress, it diminishes that negative feeling and allows you overall to have a better experience because you can see those peaks.”
The graph demonstrates for students that their hard work “is leading toward that happy moment, that peak that’s going to happen and, once you accept that, it kind of lifts those valleys of happiness to levels that aren’t ‘giving up’ levels. ... If you have the right perspective, failure doesn’t bring you down low to that despairing state.”
Hale neither scripts nor schedules roll out of the graph of happiness. But “it happens in every class, every semester,” he says. “There’s just a moment that’s the right time. The conversation is going that direction, or I can just see the mood.”
That moment came for Momoka Goto ’21 during a summer research project.
Seeing the graph of happiness “helped us to keep thinking that we were doing a good job,” Goto, a physics major, says. “Some days, we did not make much progress but we stayed positive with the graph of happiness. After all, nine weeks of summer for me was long and was not fully productive in terms of the work and results, but I think Dr. Hale supported us with great lessons to be a good scientist.”
Anh Le ’21 said he had “to repeat the same experiment over and over again to hopefully get the perfect data to analyze. … The number of tries my partner and I had to do was up to about 500.”
Their experiences prompted Hale to show them the graph of happiness, which “really did get us through tough afternoons. With the graph drawn on the board, it gives us motivation to keep trying since, the more tries we give, the more chances we get to make the experiment right.”
Browse other stories
-
Athletics
-
Women's Lacrosse - Tigers Move to 8-5 with Win at Wittenberg
-
Baseball - Vallone Chosen NCAC Baseball Pitcher of the Week
-
Men's Golf - Benedict Selected NCAC Men's Golfer of the Week
More Athletics
-
-
News
-
Professor David Alvarez receives prestigious Fulbright award
-
2024 Total Eclipse at DePauw
-
DePauw University receives $200 million in gifts for transformational liberal arts education
More News
-
-
People & Profiles
-
11 alums make list of influential Hoosiers
-
DePauw welcomes Dr. Manal Shalaby as Fulbright Scholar-in-Residence
-
DePauw Names New Vice President for Communications and Strategy and Chief of Staff
More People & Profiles
-
-
Have a story idea?
Whether we are writing about the intellectual challenge of our classrooms, a campus life that builds leadership, incredible faculty achievements or the seemingly endless stories of alumni success, we think DePauw has some fun stories to tell.
-
Communications & Marketing
101 E. Seminary St.
Greencastle, IN, 46135-0037
communicate@depauw.eduNews and Media
-
News media: For help with a story, contact:
Bob Weaver, Senior Director of Communications.
bobweaver@depauw.edu.
