The KASCADE Air Shower Visualization Project
The purpose of the project is to provide a visualization of the characteristics of cosmic ray and gamma ray induced air showers. Currently, four static plots are generated. “Particle Tracks” displays the tracks of the charged particle sin the air shower. “Photons on the Ground” shows the location on the ground of the Cherenkov photons generated by the air shower. “Photon Arrival Times” displays the Cherenkov wavefront. “Image” shows images of the air shower that would be seen by an array of perfect (100% efficient) IACT telescopes.
Title Box:
The title box of each plot contains information about the incident particle. Here you can find: the type of incident particle (gamma ray, proton, Fe56 etc.), its energy in GeV, its direction (angle from zenith and azimuth), and an ID number. The ID numbers identify individual showers with the same incident parameters and allow the viewer to connect the four plots for one shower.
Charged Particle Tracks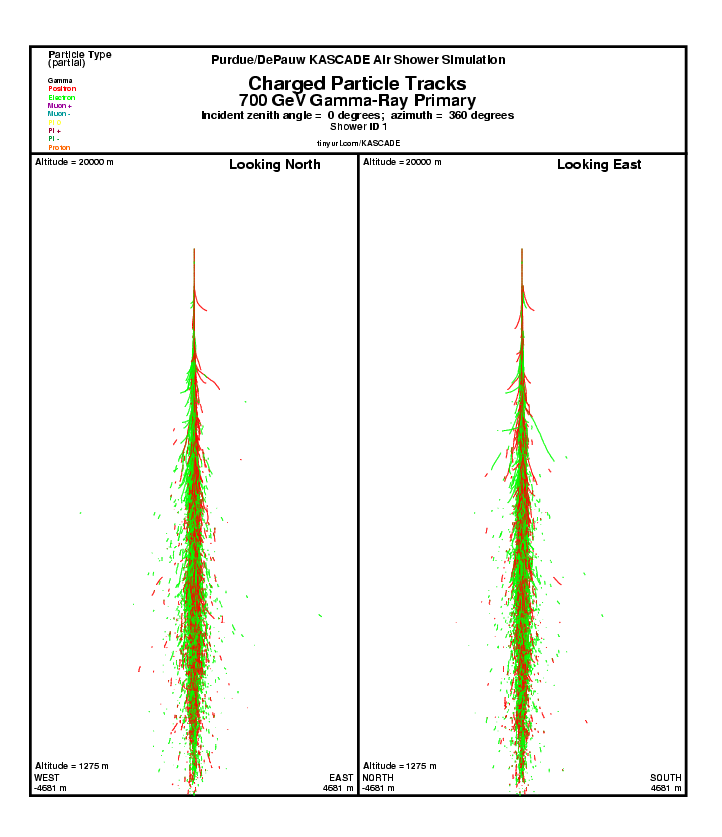
The development of the atmospheric cascade is displayed in this plot. The trajectories of all charged particles with energy above the Cherenkov threshold are drawn. The color of the particle tracks indicate the type of particle in the cascade. A complete legend of the track colors can be found here (link under construction). Since this graphic displays only charged particles, the initial track of an incident gamma ray will not be drawn. However, the point of the first interaction by the incident gamma ray is easily seen as the start of the highest electron or position track. The maximum altitude on the plot is 20,000 m, and the minimum is 1275 m, the altitude of the VERITAS observatory. The center of the horizontal scale is the location at which the incident particle would have impacted the Earth if it had not interacted, and horizontal scale spans +/- 4681m from the point. The horizontal and vertical scales are approximately equal.
Notable Features:
Notice that in the “Looking North” view, the effect of the Earth’s magnetic field is evident. Electrons (green tracks) within the cascade will preferentially deflected west while the positrons (red tracks) will experience a new eastward deflection.
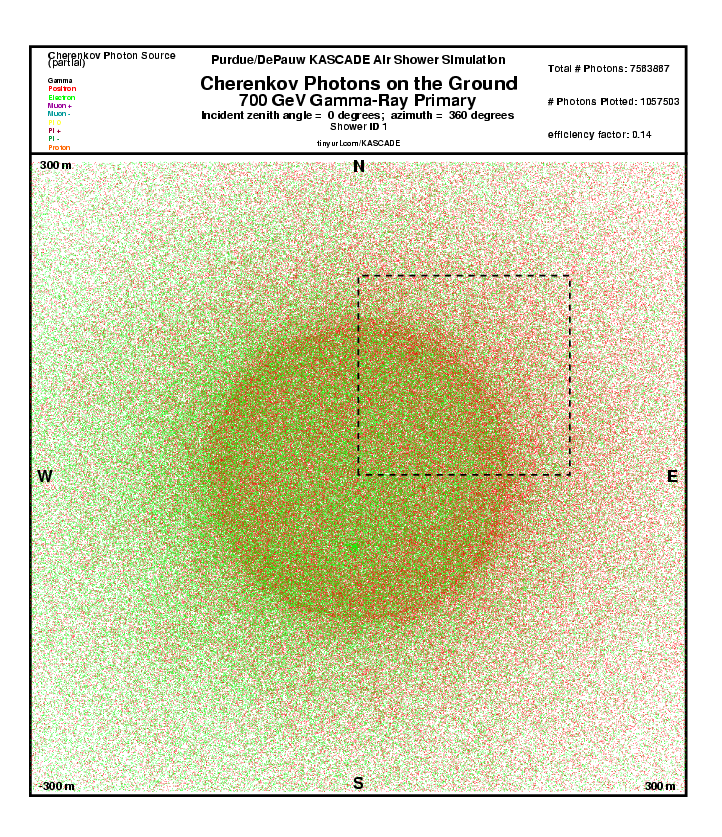
Photons on the Ground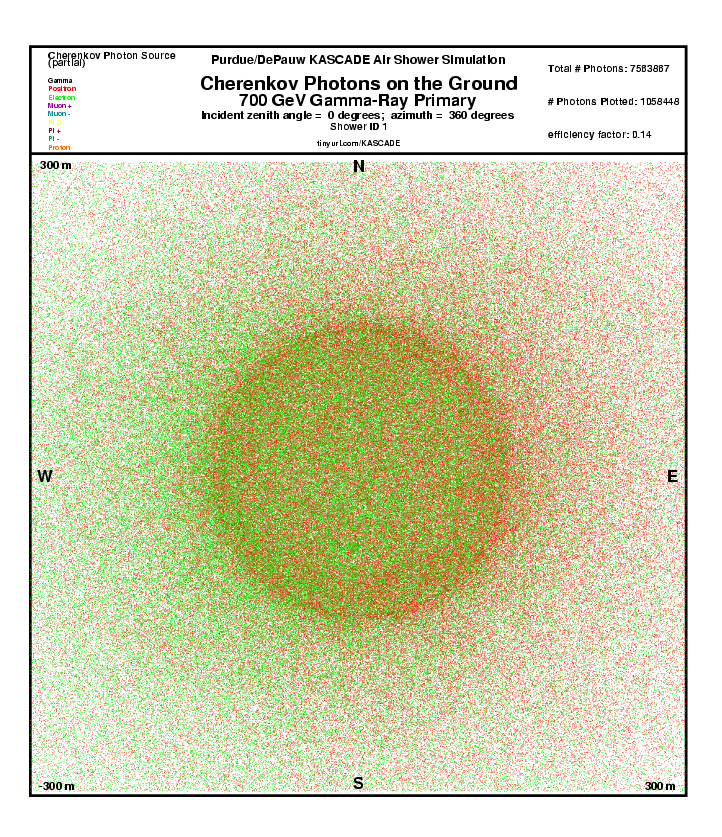
The location on the ground of the Cherenkov photons generated by the charged particles in the cascade are shown on this plot. The center of the plot is the location at which the incident particle would have impacted the Earth if it had not interacted. The horizontal and vertical scales are equal and span +/- 300m from the center. The four cardinal directions are indicated on the plot. The total number of Cherenkov photons in a typical cascade would saturate the plot and render any meaningful structure impossible to see. Photons are randomly selected to be included in this plot such that approximately 1 million photons are plotted.
Notable Features:
Notice the separation of photons due to electrons (green) from those due to positrons (red). Just as in the particle track display the effect of the Earth’s magnetic field is apparent.
The Cherenkov ring with a radius of ~150m is quite evident. The photon density with the ring is relatively uniform, and the number of photons outside the ring falls off dramatically.
Grid Image Plot Positive Quadrant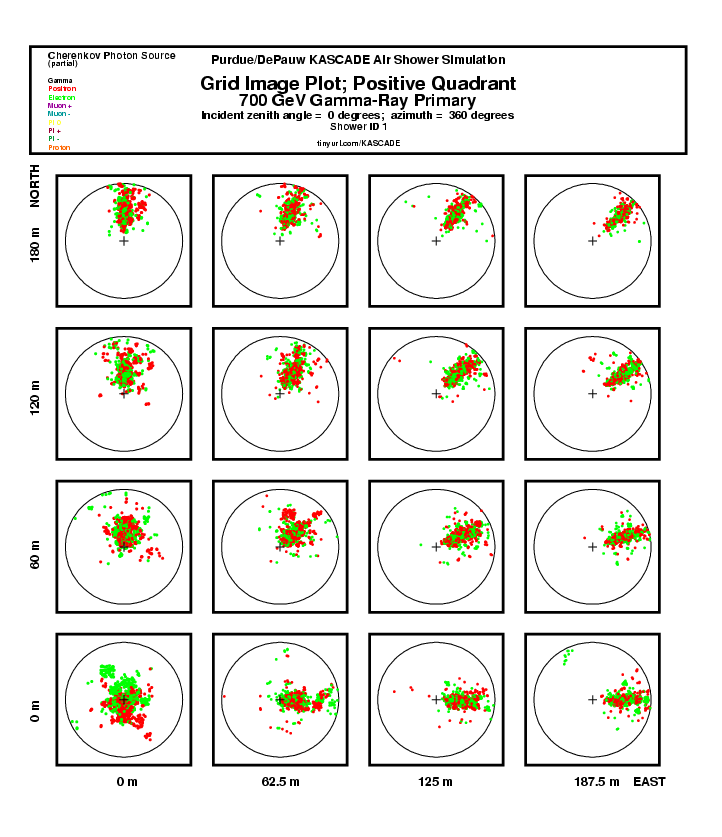
This plot shows idealized images of an air shower as seen by 16 imaging atmospheric telescopes placed at different locations within the photon footprint on the ground. The telescopes are placed on an X,Y grid, with X in the East/West direction and Y in the North/South direction. KASCADE uses a rectangular grid with a step size of 12.5m meters in the east/west direction and 12.0m in the north/south direction. The point X= 0, Y=0 is defined to be the location on the ground at which the incident particle would have impacted the Earth if it had not interacted, and is shown by the black X in the center of the lower left square. Each square on the plot is one 12.5 by 12 m area on the ground with the center values shown along the plot edges. The black circles represent a 3.5 degree field of view in the camera plane of a VERITAS like IACT. All photons that land in the specified rectangular area on the ground and fall within 3.5 degrees of the camera center in the camera plane are plotted. The colors indicate the particle type from which the photon originated.
Notable Features:
An IACT placed at the core of the air shower will see a circular image. As the telescope is moved away from the shower the core, the image becomes elongated and it shifts away from the center of the camera. Note also that the elongated image points towards the center of the camera.
Photon Arrival Times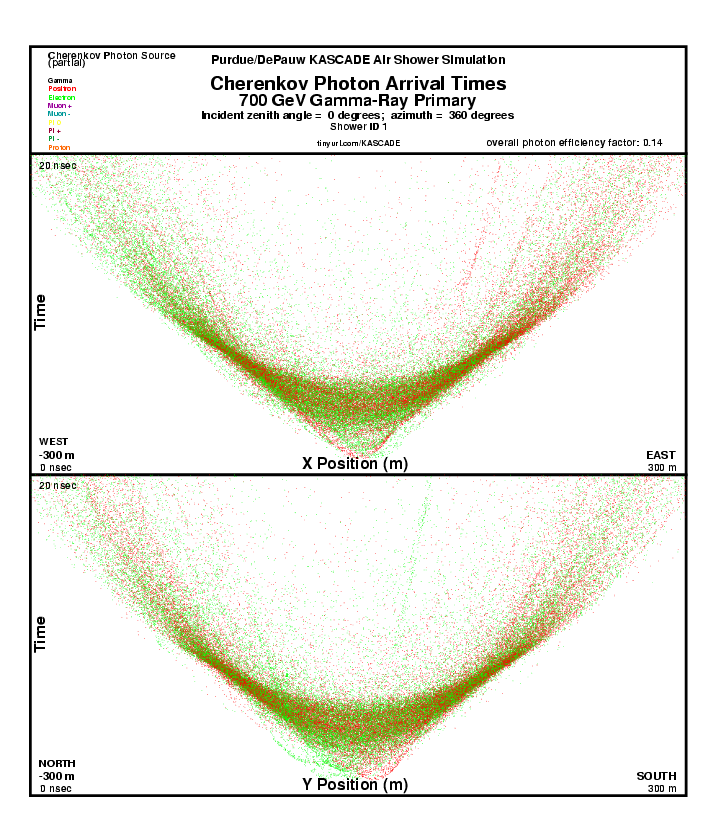
This plot shows the timing structure of the Cherenkov wavefront. The vertical axis is the arrival time on the ground of the Cherenkov photons. Time = 0 is defined to be the time that the incident particle would have impacted the Earth had it not interacted. The maximum value of time displayed is 20nsec. The horizontal axis extends +/- 300m from the shower center. The point X= 0, Y=0 is defined to be the location on the ground at which the incident particle would have impacted the Earth if it had not interacted. The upper plot shows the X (east/west) location on the ground of photons that are within +/- 30 m of the Y=0 (shower core) location. The lower plot shows the Y (north/south) location on the ground of photons that are within +/- 30 m of the X=0 (shower core) location.
Notable Features:
The temporal focusing at a distance of ~150m from the shower core is very evident in this plot.
More Information on Plots:
 |
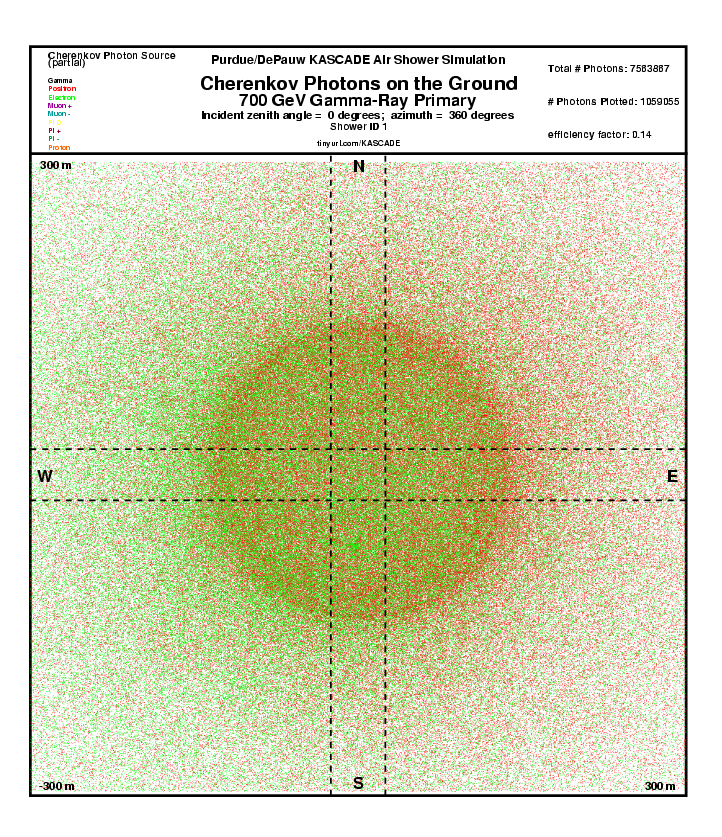 |
| The dashed box indicates the region of the photon footprint that is displayed in the Grid Image Plot. | The dashed lines indicate the East/West and North/South slices displaying in the Timing Plot. |