Professor Humberto "Bert" Barreto

December 15, 2016
Humberto “Bert” Barreto, Q.G. Noblitt Professor of Economics and Management, is busy. Not only is he teaching, he recently published a third book on using Excel for economics pedagogy and is working on a couple of research projects.
In his recent publication, Teaching Macroeconomics with Microsoft Excel, Barreto presents a novel approach to teaching economics. It includes teaching notes on how to implement economic models, gather data, and conduct simulations in Excel, among other innovative methods that are outside the mainstream of teaching.
“Let’s Get Demography Back into Economics” is the title of a paper that Barreto and former DePauw Economics and Management Professor Guangjun Qu are writing. Demography is the study of statistics such as births, deaths, income and the incidence of disease, which illustrate the changing structure of human populations.
One of the models economists use to study long-term economic growth is the Solow Growth Model, named after Robert M. Solow who won a Nobel Prize in 1987. The Solow Model takes into account several factors, including population growth and the rate of technological change – how much innovation there is. “Another crucial variable is the savings rate – the fraction of income that people save,” Barreto says. It’s an important factor in determining an economy’s performance over time.

The Management Fellows Program
The Management Fellows Program blends a traditional liberal arts curriculum with real-world experiences in business and entrepreneurship.
Read MoreHowever, Barreto believes that demographic makeup of an economy is also very important. He is working to extend the Solow Model so that it doesn’t have just a single saving parameter variable, but also incorporates the population’s age distribution into it as well.
“If you had constant proportions of young, middle and old people, then the Solow Model works, but what if you have a situation like Japan?” Barreto asks. Today, the population is changing rapidly and there are very fewer young people, some middle-aged and many more older people. The saving rate changes as we age. “Because of that, you can’t use a constant parameter for the saving rate if the age distribution is changing. You have to incorporate that into the model,” he says.
Economics books in the 1800’s and even up to WWII, contained chapters on population and show age distribution pyramids. “However, if you take an econ book off the shelf today, it won’t tell you anything about population,” Barreto says.
There used to be a broader concept of what economics is and what it studies – things like demography. Today, it’s more mathematical and model-based. “It’s much more technocratic and quantitative, and that’s okay,” Barreto says. “I teach math in my classes, and I love statistics. I like that part of economics, but I think it has made the study of economics narrower.”
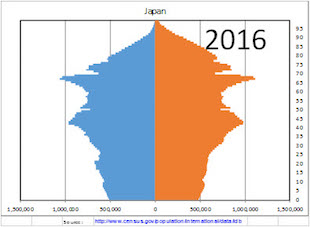
Barreto describes Japan as a big puzzle in economics now. Its economy has performed poorly for two decades; whereas before, in the 1970s and ‘80s, it was thriving. Traditional economic policies to fix the economy and help it grow haven’t worked. “I think a lack of understanding the underlying demographic headwinds that they face is part of the problem,” he says.
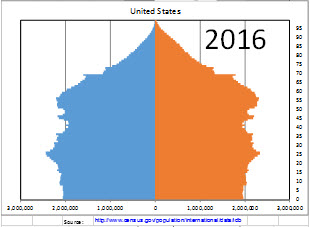
In a poor developing country, the population pyramid looks literally like a pyramid. Poorer countries have lots of young people, and fewer older people. That’s pretty classic. The United States’ pyramid looks more like a house. We have falling birth rates, too, but we have lots of immigration.
Japan’s pyramid is inverted at the bottom, and the base is quite narrow. They have a very low birth rate in addition to people living a longer, and very little immigration.
“College Administration Costs and Returns” is a project Barreto has recently begun working on with Michelle Villinski, Hiram L. Jome Professor of Economics and Management. Using Form 990, they plan to collect data from a plethora of colleges and universities to learn how much they are paying their top administrators, including presidents.
Nonprofit organizations, including colleges and universities, file Form 990 with the IRS. It’s a statement of their financial position – assets and liabilities, how much money they’ve raised and how much they pay their officers and top five highest paid workers.
“There are so many questions we could ask,” Barreto says. “Of course, you have to pay the CEO of a company a lot of money, but is this true of a university?” Barreto and Villinksi have discovered there is very little research done about this.
“If I had data on what every administrator’s salary is, I could correlate that with a performance metric for the school – the graduation rate, for example,” Barreto says. He could see if the rate is associated with how much the president and administrators are being paid. “Are these people worth it, and how much variability in administrative pay is there? The goal is to find out if investment in administration translates into some kind of measurable difference in output,” he asks.
Barreto thinks there are many interesting questions you can ask. For example, it would be curious to see how liberal arts colleges compare to public universities. He and Villinski are just beginning their work to extract the data.
For more information about the Economics and Management Department and its faculty members, visit the website.